Plots
To add or customise plot select "Plots" menu option.
- Use name and title input to filter the list
- Click on plot list to show the plot in the genome browser
- Click on plot list to edit the plot

Adding new plot
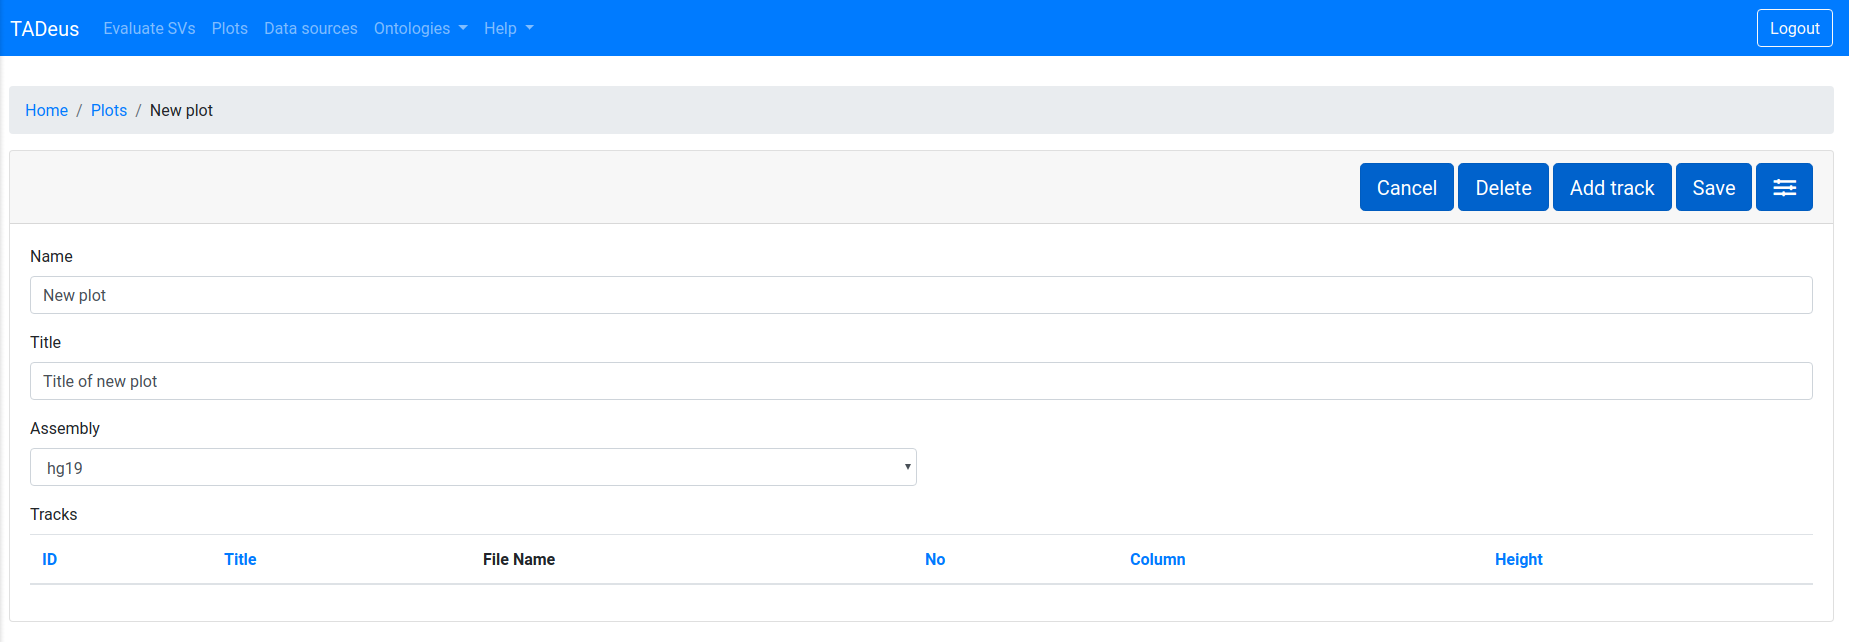
To add a new plot click on "Create" button and complete the form with the name, the title and the assembly of the new plot.

After clicking "Create" modified form will be displayed.
- Click "Delete" button to delete the plot
- Click "Add track" button to add new genomic track
- Click "Save" button to save modified data
- Click to show the plot in the genome browser

Adding new track
Each datasource can be displayed in browser as a separate track. To add new track to the plot click on "Add track" button.

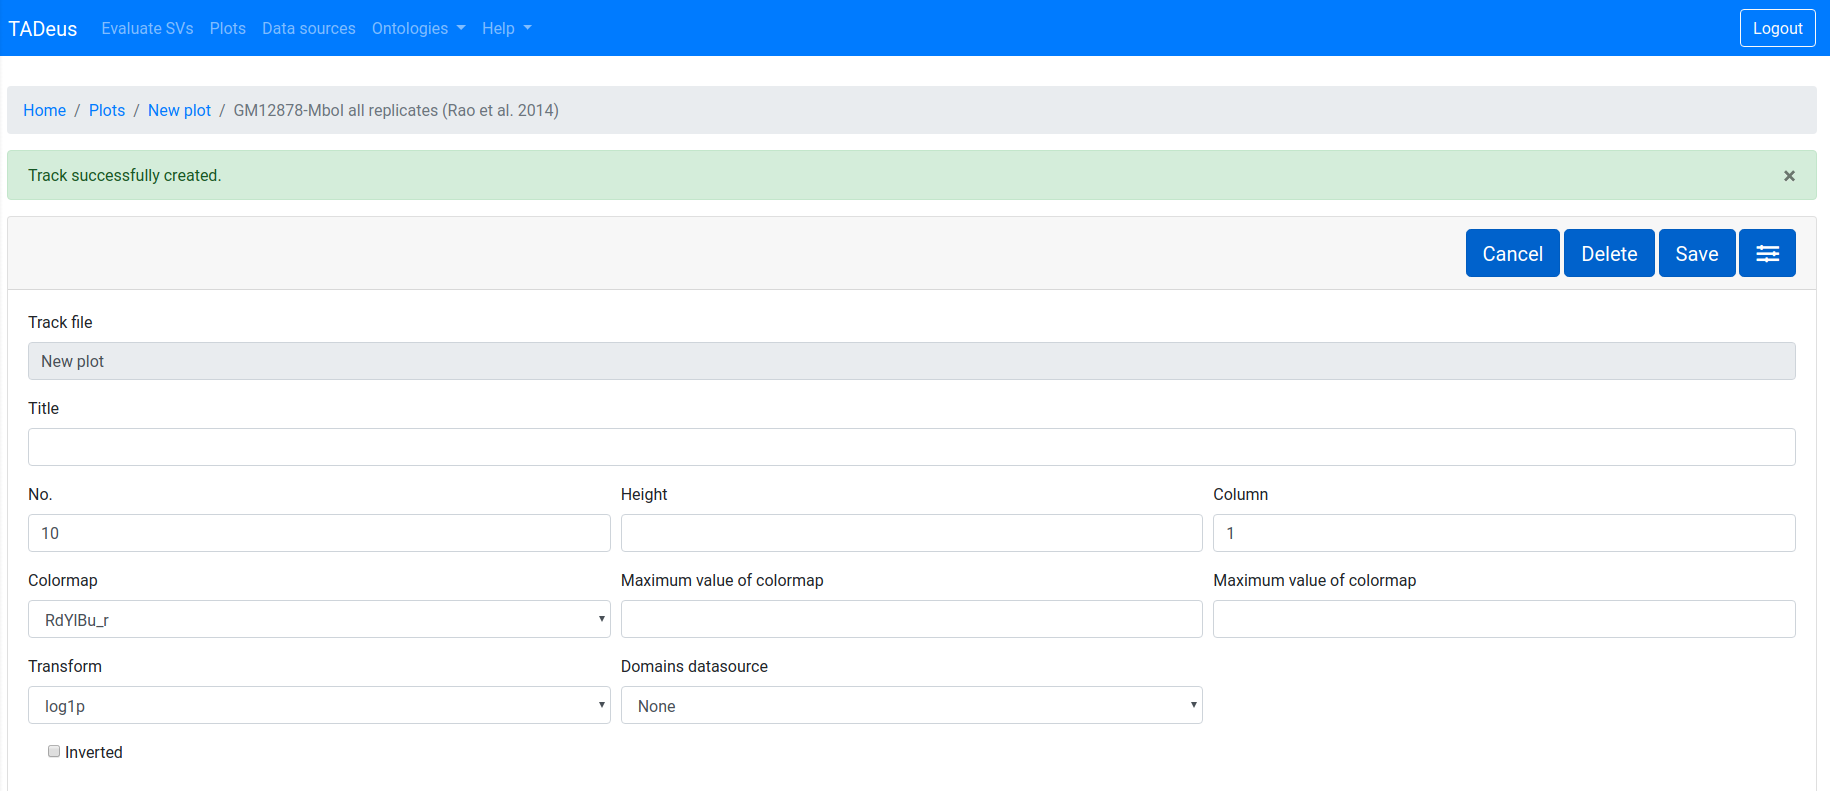
Then choose the datasource from the select list of available datasources. You have to complete other fields of the form including:
- Title — title of the track
- No. — number of the track. Used to order tracks in the plot
- Height — height of the track. If none default size is used
- Column — colum number. Plots can have many columns
After filling the form click "Create". Then form complemented with fields specific for type of datasource (BED3, BED6, BED9, BED12, BEDGraph or Hi-C) will be shown. Detail description of each field is presented in the table below.

List of track properties
| Name | Datasource type | Values | Description |
|---|---|---|---|
| Title | All | Text | Name of the track |
| No. | All | Integer | Track number. Used to order tracks in the plot |
| Height | All | Integer | Height of the track. If none default size is used |
| Column | All | Integer | Column number |
| Color | All BED, BEDGaph | Color in hex RGB without leading hash | Color of feature |
| Border color | All BED, BEDGraph | Color in hex RGB without leading hash | Border color of feature |
| Colormap | BED6, BED9, BED12, Hi-C | List of Python Matplotlib Colormaps | Colormap used to display values from 'score' column of BED datasource entry, or to display frequencies of Hi-C map |
| Minimum value of colormap | BED6, BED9, BED12, Hi-C | Number | Minimum value of colormap |
| Maximum value of colormap | BED6, BED9, BED12, Hi-C | Number | Maximum value of colormap |
| BEDGraph Style | BEDGraph | Line, Line with borders, Area, Area with border |
Available options:
|
| BED Style | All BED | Tiles, With Introns, Flybase, Domains, Arcs |
Available options:
|
| Display | All BED | Stacked, Collapsed, Interlaced |
Available options:
|
| Print option | All BED | Tiles, Vertical Lines, Tiles and Vertical Lines |
Available options:
|
| Labels | All BED | Yes, No | If value is set to 'Yes' labels for each feature will be printed using 'name' column value of BED |
| Name filter | BED6, BED9, BED12 | Yes, No | If set to 'Yes' user can filter entries from BED datasource by 'name' column value |
| Transform | Hi-C | none, log1p, log, -log |
Available options:
|
| Domains datasource | Hi-C | List of data in BED format (public and private for user) | Coordinates of the entries from the chosen BED datasource will be used to draw domians on Hi-C track |
| Inverted | Hi-C | Yes, No | If set to 'Yes' Hi-C matrix will be displayed inverted |
Customising plot
To customize plot click on plot list to edit the plot. Then click to customize specific track.
